CUDA · from scratch
Writing a CUDA matmul that catches cuBLAS — then training a GPT on it
Eleven rewrites of a single kernel, from the naive version everyone writes first to a double-buffered, warp-tiled one — and then tensor-core versions that pass NVIDIA’s hand-tuned library. Then a language model trained end to end on those kernels, with no PyTorch and no vendor BLAS anywhere in the training path.
The numbers on this page were measured on an RTX 5080 Laptop (Blackwell, sm_120): 60 SMs, 896 GB/s of memory bandwidth, 16 GB, 48 MB of L2. It is the third card this project has run on — it began on an RTX 4070 Laptop (Ada, sm_89; 36 SMs, 256 GB/s, 8 GB) and passed through an RTX 5070 Ti Laptop (46 SMs) — and where the text below reasons about a specific card by name, that is the card it was measured on. No table mixes them.
At the clock these benchmarks run at, the card can do about 18.4 TFLOP/s of fp32 and move 896 GB/s. Divide them and you get the ridge point: 20.6 FLOP/byte. Every byte read from memory has to feed 21 floating-point operations before the arithmetic units stop waiting on memory. A naive matmul manages 0.25.
That gap — a factor of ~80 — is the entire project. Almost every optimization below is the same move applied at a different level of the memory hierarchy: load a value once, then spend it on as much arithmetic as possible before letting it go.
The eleven kernels
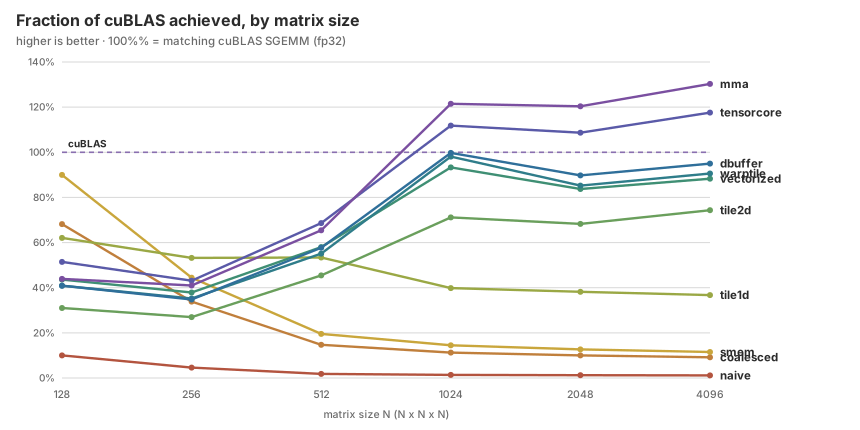
GFLOP/s at N=4096, SM clock pinned to 1200 MHz, median of three independent sweeps. The cuBLAS baseline is fp32, which is what cuBLAS does by default. Kernels 9–11 use tensor cores and are therefore not computing the same thing — see below. Kernel 9 sitting below kernel 8 here is not a typo; it is the finding described in the section on WMMA further down.
| # | kernel | GFLOP/s | % cuBLAS | FLOP/byte | what changed |
|---|---|---|---|---|---|
| 1 | naive | 138.2 | 1.1% | 0.25 | one thread per output element, uncoalesced |
| 2 | coalesced | 901.0 | 7.4% | 0.25 | swapped which index maps to threadIdx.x |
| 3 | smem | 1376.6 | 11.3% | 8 | 32x32 shared-memory tile |
| 4 | tile1d | 4280.1 | 35.2% | 16 | 8 outputs per thread (TM=8) |
| 5 | tile2d | 8412.4 | 69.2% | 32 | 8x8 register tile, outer-product form |
| 6 | vectorized | 10217.7 | 84.1% | 32 | float4 loads + transposed A tile |
| 7 | warptile | 9640.4 | 79.3% | 32 | block -> warp -> thread blocking |
| 8 | dbuffer | 10604.8 | 87.2% | 32 | double-buffered SMEM, one barrier per chunk |
| 9 | tensorcore | 7875.1 | 64.8% | 64 | WMMA m16n16k8 TF32 tensor cores |
| 10 | mma | 14198.2 | 116.6% | 64 | raw mma.sync PTX, lane-major SMEM, 64x64 warp tile |
| 11 | cpasync | 15351.9 | 126.3% | 64 | cp.async staging pipeline, 64x64 warp tile |
Kernel 1 → 2: one index, 8× faster
The naive kernel maps threadIdx.x to the row of the output. That is the natural thing to write and exactly wrong. Lanes 0–31 of a warp then read addresses K floats apart, so each lane needs its own memory transaction — 32 transactions for what could be one.
Swapping the mapping so threadIdx.x is the column makes the warp read 32 consecutive floats: one 128-byte transaction. The arithmetic is byte-for-byte identical. Only the address pattern moved, and throughput went from 138 to 901 GFLOP/s.
Kernels 3–5: reuse, at three levels
Shared memory tiling gets each value loaded from global memory once per block instead of once per thread (0.25 → 8 FLOP/byte). Then register tiling attacks the next bottleneck: every fused multiply-add in the shared-memory kernel needs two SMEM loads, and shared memory cannot feed the FMA pipes that fast. Giving each thread an 8×8 patch of output means 16 loads serve 64 FMAs instead of 128.
The measurement was nearly wrong — in my favor
The problem. Left alone, this 55 W laptop GPU boosts to 3105 MHz and then sags as it hits the power cap. Measured cuBLAS at N=2048 swung between 7.6 and 12.7 TFLOP/s across runs on thermal state alone — a 60% swing in the denominator of every “% of cuBLAS” claim. I could have reported almost any number I wanted.
The fix is to pin the SM clock. 1500 MHz does not hold — the power cap drags it to ~1320 and it wanders. 1200 MHz holds rock steady through a sustained dense-GEMM load (39–47 W, 68–83 °C, clock never moved). With clocks pinned, best-vs-median across runs agrees to under 1%.
Correctness needed the same care. Elementwise relative error is the wrong metric for a matmul: each output is a sum of K products, so where cancellation drives an entry near zero the rounding noise of the other terms remains. An entry of magnitude 1e-3 can carry 1e-4 of absolute error while every input was computed correctly. Comparing worst absolute error against max|ref| separates cleanly — reordered fp32 summation lands around 1e-6, a real bug lands at 1e-1.
The profiler found what reading could not
At kernel 6 I was at 84% and out of ideas. Nsight Compute gave the answer in three lines:
DRAM Throughput          15.1%   <- global memory is not the problem
L1/TEX Cache Throughput  81.4%   <- saturated
Compute (SM) Throughput  54.2%
Shared memory and L1 share the same LSU/MIO datapath on NVIDIA hardware. 81% L1 against 15% DRAM means the kernel was bound on shared-memory-to-register traffic. The FMA units were idle waiting for operands. No further work on global memory access — the thing I had spent five kernels on — would have bought anything.
Warp tiling fixes exactly that, by adding a blocking level between the block and the thread so each value pulled from SMEM feeds more arithmetic. Loads per FMA drop from 0.25 to 0.1875. Measured after the change:
| metric | kernel 6 | kernel 7 | kernel 8 |
|---|---|---|---|
| L1/TEX throughput | 81.4% | 50.0% | 52.6% |
| Memory throughput | 73.8% | 45.3% | 46.1% |
| Compute (SM) | 54.2% | 54.8% | 55.8% |
| Warp cycles per issued instruction | 5.75 | 3.08 | 2.85 |
Kernel 8: the loop was shaped wrong
Kernel 7 left the kernel in a genuinely different regime — neither memory (45%) nor compute (55%) saturated. It was latency bound, and the reason was visible in the loop structure rather than in any counter:
load global -> shared        <- ~500 cycle latency
__syncthreads()              <- every warp blocks until it lands
compute on the tile
__syncthreads()              <- and blocks again before overwriting
The load is immediately followed by a barrier, so nothing overlaps it. Every K-chunk pays a full round trip to DRAM with the arithmetic units idle. Double buffering keeps two tiles in shared memory: while the warps compute on one, the next chunk’s loads are already in flight. It also halves the barriers, because reading one buffer and writing the other cannot conflict.
That took kernel 8 to 87.2% of cuBLAS at N=4096, and past it at sizes that divide evenly into the 128×128 block tile — 104.0% at N=1536 and 104.2% at N=6144, reproducible across runs. The cost was 219 registers against 186, and 32 KiB of shared memory against 16.
Kernel 9: the silicon I had not touched
Everything to this point runs on the SM’s fp32 FMA pipes. The card also has tensor cores, which had been idle for eight kernels. The honest way to see how much that matters is to let cuBLAS use them too:
| at N=4096 | GFLOP/s | vs fp32 cuBLAS | vs TF32 cuBLAS |
|---|---|---|---|
| cuBLAS, true fp32 (default) | 12158 | 100% | — |
| cuBLAS, TF32 tensor cores | 10544 | 87% | 100% |
dbuffer (mine, fp32) | 10605 | 87.2% | —% |
tensorcore (mine, TF32) | 7875 | 64.8% | 78.7% |
So the tensor-core kernel beats fp32 cuBLAS by -35%, and trails cuBLAS’s own tensor-core path by about 21%. Both of those are worth saying out loud; quoting only the first would be the flattering half.
TF32 is not free speed. Despite the name it has fp32’s 8-bit exponent but only 10 mantissa bits — fp32’s range at roughly fp16’s precision. Measured normwise error against an fp32 reference goes from 6.2e-08 for the fp32 kernels to 2.4e-04 for this one. That is ~4000× more error, and it is a deliberate trade, not a bug: it is the trade that makes neural network training fast, and it is why this kernel carries its own tolerance in the test suite rather than quietly loosening the bar for everyone.
Tuning it was also a reminder that intuition is not a substitute for measurement. The first version gave each thread a 4×4 grid of accumulator fragments and hit 255 registers — the hardware ceiling — which throttled occupancy. Spreading the same block tile over 8 warps instead of 4 cut that to 128 registers. And of two arrangements with identical register counts and identical instruction counts, one was 27% faster than the other, purely from how the warps’ fragment loads land in shared memory.
Four ways not to speed up a tensor-core kernel
Kernel 9 trails cuBLAS’s own TF32 path by about 21%. The obvious place to look is the profiler, which says: DRAM 64.6%, compute 36.9%, L2 hit rate 58%, occupancy 32.8%. The tempting reading is bandwidth bound — and three of the four attempts below came from taking that at face value. All four made it slower. Three runs each, N=4096:
| attempt | GFLOP/s | delta |
|---|---|---|
| grouped block scheduling | 8290 → 7677 | −7.4% |
| bigger tile, 256×128 | 8290 → 6930 | −16.4% |
BK 32 → 16 | 8290 → 7899 | −4.7% |
| double buffering | 7899 → 7518 | −4.8% |
The bigger tile is the one that settles it. A block tile’s arithmetic intensity is BM·BN / (2(BM+BN)) — 32 FLOP/byte at 128×128, and 42.7 at 256×128, which clears this card’s 43 ridge point. If the kernel were really bandwidth bound, that is the fix. It cost 16%. So it is not bandwidth bound, however much the DRAM counter looks like it.
And double buffering is kernel 8’s cure for exactly this neither-counter-is-saturated signature, which earlier in this project was worth 6%. Here it does nothing, and not for want of registers — 128 either way, twelve bytes of spill. So the latency is not on the global-memory path either.
Ruling things out is the useful part. Global bandwidth, L2 reuse, tile size and global latency are all eliminated here by measurement rather than by argument, which leaves the abstraction itself: WMMA fixes the fragment layout and forces four separate shared-memory reads per fragment where raw mma.sync would need one. That is a specific, falsifiable claim, so the next kernel tests it — and it turns out to be wrong.
Kernel 10: the hypothesis was wrong and the kernel got faster anyway
Shared memory does not have to hold a matrix. It only has to hold whatever makes the next read cheap. The mma.m16n8k8 TF32 instruction requires each of the 32 lanes to hold four particular elements of A — a0=(g,t) a1=(g+8,t) a2=(g,t+4) a3=(g+8,t+4), where g=laneid>>2 and t=laneid&3. In a row-major tile those sit at four unrelated addresses. So kernel 10 stores each 16×8 tile lane-major — lane L’s four elements at L*4 — and the fragment load becomes one 128-bit access at base + laneid*16, which is also the ideal shared-memory pattern: 32 lanes over 512 contiguous bytes, no bank conflict possible. Per warp per k-step, 24 shared-load instructions become 6, moving exactly the same 3072 bytes.
It bought 2.7%. Instruction issue on the shared path was never the constraint. The bytes were — and WMMA moves exactly as many.
The other 8% came from somewhere kernel 9 could not reach. What this kernel is actually limited by is shared-memory reuse: bytes read from shared per mma issued is 4096·(WM+WN)/(WM·WN), which falls only when both warp-tile dimensions grow — and the accumulator costs WM·WN/32 registers per thread, so reuse is a register-budget problem in disguise. Going from a 32×64 warp tile to 64×64 halves it, and is worth 8.7%, three times what hand-written PTX was worth on its own.
And that exact shape is already in kernel 9’s tuning table, at 7783 GF/s — slower than the shape it settled on. WMMA at a 64×64 warp tile needs 255 registers and spills; the hand-written version spills four bytes. So raw PTX did matter — indirectly, by making the tile affordable rather than by making the loads cheaper. The stated hypothesis was wrong and the conclusion drawn from it was right, which is not the same thing as being right.
| at N=4096 | GFLOP/s | vs cuBLAS TF32 |
|---|---|---|
| kernel 9, WMMA | 8318 | 79.2% |
| kernel 10, raw mma.sync, same tile | 8540 | 81.3% |
| kernel 10, 64×64 warp tile | 9210 | 87.7% |
Two failures on the way, both worth more than the result
A fragment layout is a fact to measure, not to recall. I wrote the A register order from memory and swapped a1 and a2 — correct for the analogous f16 shape, wrong for TF32, which concatenates two k4 chunks rather than two row halves. The kernel compiled, ran at full speed, and returned garbage. Guessing produced a silent wrong answer, so there is now a one-hot probe that discovers the mapping on the hardware: set one element of A to 1, make B the identity, and see which lane and register light up.
Fewer instructions is worth nothing if the bytes arrive four at a time. The first correct version ran 8% slower than the WMMA kernel it was meant to beat, on a layout whose entire justification was cheaper shared access. Lane-major staging is 8-way bank conflicted on A and 16-way on B, because a warp of staging threads varies only in bits the slot index scales by 4. The fix is an XOR swizzle keyed on the tile index: staging sees it vary across the warp and spreads out, while a fragment load reads one whole tile per warp so it is uniform there and the permutation is invisible. 8-way and 16-way become 2-way, and the load stays perfectly conflict-free.
That is index arithmetic, not a hardware mystery, so it can be settled without a GPU. tools/smem_banks.py derives both layouts, proves they are bijections, checks that a fragment load picks up exactly the elements the instruction demands in exactly the right register slots, and simulates the bank pattern of every access.
Putting it in the model, where it behaves differently
The ladder kernel only does NN; the model needs all four transpose cases. The layout ports cleanly, because it is a function of the logical element (m,k) rather than of how the operand is stored — all four cases share one map, and only the axis the global float4 runs along changes. 67.7 → 65.2 ms per training step, 3.7%, replicated three times each way at a pinned clock, with identical loss to four decimals.
But the swizzle has to key on the axis staging walks. It must be uniform across a warp doing a fragment load and varying across a warp doing a staging store, and only one tile coordinate is both — the one the staging warp walks, which the transpose flag decides. I ported the untransposed key to all four cases. For the transposed ones that is warp-uniform during staging, so the swizzle does nothing and the stores go back to 16-way conflicted. It is not a correctness bug, so every test passed. It showed up only as the transposed cases running 20% slower than the WMMA path they replaced: geomean over the model’s twenty shape/transpose combinations was 0.887×, and 1.044× with the key fixed. What identified it was the pattern — NN and NT near parity, TN and TT at 0.80–0.84, which is exactly the half where transA is true.
And the best tile on a square benchmark is not the best tile in the model. On the 4070, the 64×64 warp tile that was worth 8.7% at N=4096 lost in situ, 1.034× against the narrower shape’s 1.044×. The model’s GEMMs are 4096×384×384 and friends, so a 128×128 block tile gave 96 blocks against 36 SMs — the machine is not full, and a 128-thread block brings half as many warps per SM to hide latency with. The ladder and the model deliberately run different tiles.
On the 5080 that gap closed to nothing, which is the more interesting outcome. Re-run as a runtime A/B — both arms in one binary, interleaved in both orders — the two warp tiles are separated by +0.04% across 54 shape-measurements, and the per-shape signs agree across three runs on only 4 shapes of 18. The control is what says why: a square 4096³, where this tile was worth +8.7% on the 4070, now reads +0.0%. The benefit did not move from square shapes to skinny ones, it evaporated on the shape where it was strongest. Cutting shared-memory traffic per mma by a third buys nothing here, so shared bandwidth is no longer what limits this kernel — on Ada the identical change proved that it was.
The compiler optimized the thing it could see
Kernel 9 sat at 8064 GF/s until a question about a version number. The writeup said CUDA 12.5; 13.3 was also installed. Building the same source with both — same machine, same pinned clock, N=4096 — eight of the nine kernels then written came out indistinguishable, and one did not:
| kernel | CUDA 12.5 | CUDA 13.3 | delta |
|---|---|---|---|
| naive … dbuffer | — | — | within 1% |
tensorcore | 8064 | 6499 | −19.4% |
A fifth of the throughput, reproducibly, at identical numerical error — so it was still genuinely TF32, just slower. ptxas -v gives the whole story in two lines:
12.5:  128 registers, 12 bytes spill stores
13.3:  142 registers,  0 spills
nvcc 13.3 spent 14 more registers to eliminate a 12-byte spill. In isolation that is a good trade. Here it crosses an occupancy cliff, because registers are allocated per warp in multiples of eight and this kernel runs 256 threads per block:
- 128 regs → 4096/warp → 65536/4096 = 16 warps per SM → 2 resident blocks
- 142 regs → rounds to 144 → 4608/warp → 65536/4608 = 14 warps per SM → 1 block
Halving the resident blocks to avoid twelve bytes of spill. The compiler optimized what it could see — the spill — and could not see what it cost.
The fix is to state what the kernel needs instead of hoping the register allocator infers it. The second argument to __launch_bounds__ is minimum blocks per SM:
__global__ __launch_bounds__(NUM_THREADS, 2) void tensorcore_kernel(...)Both toolkits then allocate 128 registers and accept the spill. This is not a 13.3 workaround — it is faster on both. On the 4070, where this was found:
| toolkit | before | after |
|---|---|---|
| CUDA 12.5 | 8064 (113.9%) | 8250 (116.7%) |
| CUDA 13.3 | 6499 (91.6%) | 8290 (117.3%) |
A spilled byte is cheap; a resident block is not. __launch_bounds__ is how you tell the compiler which one you are buying. With the fix in place the two toolkits agree across the board, so the build now takes whichever is newest and prints which one it used.
The lasting lesson is not that one compiler release regressed. It is that a 19% loss passed every correctness test, every gradient check and every loss curve without a murmur, and surfaced only because someone asked why a page said 12.5. Performance regressions are invisible to correctness testing by construction. The only thing that catches them is measuring on purpose.
Then: a language model on top of it
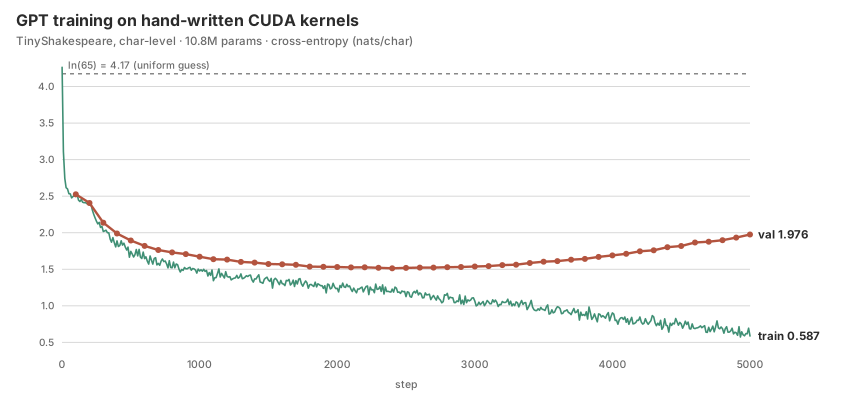
A matmul is only interesting if something uses it. So the second half was a GPT — 6 layers, 6 heads, 384 embedding, 256 context, weight-tied head, 10.8M parameters — trained on character-level Shakespeare. Layernorm, GELU, causal multi-head attention, softmax, cross-entropy and AdamW are all hand-written; every matmul routes through the kernels above.
The backward pass needs dX = dY·Wᵀ and dW = dYᵀ·X. Rather than materializing transposed copies — an extra bandwidth-bound pass over the data — the transpose folds into the shared-memory staging. The A tile was already stored transposed, because that is what makes the per-thread register reads contiguous, so each of the four transpose cases is just a different index map.
A falling loss does not verify a backward pass
This is the part most from-scratch projects skip. A dropped correction term in layernorm still produces a descending loss curve — just a worse model. So the gradients are checked against finite differences directly.
The naive check perturbs one scalar and watches the loss, but in fp32 that barely works: individual gradients here are ~1e-4, so the loss moves by about as much as the forward pass’s own rounding noise. Instead each parameter tensor is stepped along u = g/‖g‖, so every element contributes coherently and the predicted change is exactly ‖g‖ — three orders of magnitude above the noise floor.
All 16 parameter tensors agree to 1e-5…2e-3. And the check is sensitive: deliberately deleting the x̂·mean(dx̂·x̂) term from layernorm backward makes 14 of 16 tensors fail immediately. (The two that still pass are the final layernorm’s weight and bias — their gradients do not flow through the path that was broken, which is exactly right.)
What it writes
Sampled from the best checkpoint at temperature 0.8:
What the profiler found that I never would have
This repo had the tooling to profile a training step for two sessions before it ever ran one, because reading GPU performance counters needs administrator on Windows and it never seemed worth the interruption. It was worth the interruption. One click, thirty seconds, and it said something I had not guessed — twice.
| share of a training step | before | after |
|---|---|---|
| GEMM | 62.4% | 64.9% |
| attention backward | 14.4% | 15.7% |
| bias add / column reduce | 8.2% | 3.3% |
| GELU | 4.4% | 4.8% |
| layernorm | 3.2% | 3.4% |
| attention forward | 3.1% | 3.4% |
| optimizer | 2.4% | 2.6% |
| residual add | 1.2% | 1.3% |
67.7 → 59.9 ms per step, 11.5%. Everything that grew as a share grew because the total shrank.
The bias add did not need to exist
Second biggest thing in the step, for one add per element. As its own kernel it reads the entire output tensor and writes it back to do that; in the GEMM epilogue — which is already holding the value in a register, about to store it — the same add costs two floats per lane out of L1 and no global traffic at all.
There is a reason it was a separate kernel, and it is not laziness. Adding a per-column value in an epilogue requires knowing which accumulator register holds which column, and that is exactly what WMMA’s fragment type hides. Kernel 9 could not have done this; the raw-PTX kernel can, because the register mapping is the thing it was built around. The abstraction that turned out not to be the bottleneck for arithmetic turned out to be a real constraint on what could be fused — a better argument for writing the PTX than the 2.7% was.
The column reduction read memory the wrong way round
What was left after fusing the forward was the bias backward, at 5.4% of a step for an operation whose floor is a single streaming read. It ran one block per column, striding down the rows — under a comment of mine asserting the reads were coalesced because consecutive blocks own consecutive columns. They were not. Coalescing happens within a warp, and in that arrangement a warp’s 32 threads read 32 different rows at the same column: 32 addresses C floats apart, so 32 separate transactions fetching 32 bytes each to use 4.
Neighbouring blocks do re-use those sectors out of L2, which is why it was bad rather than catastrophic — and why it survived. Nothing about the source looks wrong. It has the shape of a coalesced kernel and a comment explaining why it is one. The fix is the first thing anyone learns about CUDA.
The residual and GELU go the same way, and cost three detours
Same waste, same fix — and two activation buffers that then had nothing left to hold, since attproj and fcproj are never read again, not even by the backward. fp32 70.1 → 69.1 ms, TF32 59.8 → 58.9 ms, 0.91 → 0.84 GB resident. About 1.5% — and getting to an honest 1.5% took three detours that are worth more than the number.
It measured as 37% first. The profile said total kernel time had barely moved, which is the only reason I looked: ncu resets the application clock when it detaches, so an earlier clock lock had been silently undone and the card was boosting. 59.9 → 38 ms is 1.58×; it was a clock ratio wearing a speedup’s clothes. This project already had a rule about never quoting a ratio on an unpinned clock. What it did not have was a way to notice the pin coming undone mid-session.
Then the loss started varying in the fourth decimal, which looked exactly like a race I had just introduced. It is not mine and it is not new: two backward kernels accumulate through global atomics, so floating-point summation order varies between runs. The parent commit does it too — 1 run in 14. I was one plausible story away from attributing a pre-existing property of the model to my own change, and what prevented it was building the parent and running it fourteen times.
And the fp32 path came out 6% slower. Not register pressure — 219 against 221, essentially unchanged. The epilogue tested if (ep.gelu_out) at runtime, and tanhf expands to a substantial block of code that sits in the kernel whether or not the branch is taken. Making the feature set a template parameter and testing it with if constexpr turned a 6% regression into a 1.4% gain. Code you do not execute is not free.
One kernel was never going to be enough
Before starting on the attention backward I noticed the GEMM benchmark had never covered three of the model’s own shapes. Adding them showed the attention-projection weight gradient running at 1846 GF/s where every other shape reaches 7000–8000. A 128×128 tile cuts 384×384 into nine blocks on a 36-SM card; three quarters of the machine is idle and no amount of inner-loop work fixes that.
Two fixes, both shape-dependent — which is the point, and is why cuBLAS ships dozens of kernels rather than one good one. A second, half-height tile (64×128, 4 blocks/SM) for grids that cannot fill the machine once: +25% on the nine-block shape, −3% on the 96-block ones, so it is chosen per shape. And split-K when the output is small and K is long.
I had costed split-K before, for 4096×384×384, and correctly rejected it: the output there is 6.3 MB, so every extra partial is another 6.3 MB of traffic to recover a third of a wave. The weight gradients are the opposite shape — 590 KB of output against K=4096 — so the partials are nearly free. Same technique, opposite verdict, and the deciding quantity is K against M·N, not the wave count I had been staring at.
| weight-gradient shape | before | after |
|---|---|---|
| 384×384×4096 | 1846 | 6899 |
| 384×1152×4096 | 4223 | 7727 |
| 384×1536×4096 | 5591 | 7673 |
| 1536×384×4096 | 5578 | 7623 |
58.9 → 54.0 ms per step. The part worth dwelling on is that three of the four largest matmuls in the backward pass had never been measured individually, so the one running at a quarter speed was invisible — averaged into a GEMM category that looked healthy at 65%.
The clock lock does not stay locked
Twice now a change has measured as a large speedup and been a clock ratio. ncu resets the application clock when it detaches; the lock has also lapsed on its own. Both times the number looked plausible — 59.9 → 38 ms is 1.58×, and so is 1900/1200. This project already had a rule saying never to quote a ratio on an unpinned clock, and that rule does not survive a pin coming undone silently, between the pinning and the measurement. Every timing run now reads the clock on both sides of itself and labels the output UNPINNED if either reading is wrong. A discipline that depends on remembering to check is not a discipline.
The two biggest wins available in a step I had spent months optimizing were a pass that did not need to exist and a reduction that read memory backwards. Both were in code I wrote, read, and commented. Neither is subtle once seen, and I did not see either one — I spent the preceding sessions chasing 2–8% inside a matmul that was already at 88% of cuBLAS, because that was the part I found interesting. The profiler does not care what is interesting.
Fusing attention: the score matrix never exists
The table above says attention costs about 21% of a training step across three kernels. None of them is badly written — the batched GEMM is the same code that reaches 90% of cuBLAS. The cost is structural. A (B, NH, T, T) score matrix gets written to global memory and read back, and the softmax over it does roughly 5 flops per 8 bytes on a card whose ridge point is 20.6 FLOP/byte. That is a fraction of a percent of peak no matter how good the kernel is. The only fix is to not have the intermediate.
A softmax normally needs the whole row before it can emit anything, because it needs the row max and the row sum. But both are running statistics. After seeing part of a row you hold a partial max m and partial sum l, and when a later block raises the max to m′, everything computed so far is corrected by one factor — exp(m - m′):
m' = max(m, rowmax(S_j))
l' = l * exp(m - m') + rowsum(exp(S_j - m'))
O' = O * exp(m - m') + exp(S_j - m') @ V_j
with O divided by l only at the end. Each score tile lives in registers for the few instructions it takes to consume it and is then gone. This is FlashAttention. Note it does more arithmetic than the unfused version, not less — the whole win is in what never gets written.
Two more wins fall out of the structure, and on this hardware they matter as much as the famous one. Causality becomes a loop bound rather than a mask: the unfused path computes all T×T scores and discards the upper triangle inside the softmax, while a query block here simply never visits key blocks past its diagonal — so both attention matmuls do half the work. And the head permute disappears: the unfused path pays a bandwidth-bound pass over 3·B·T·C to make each head’s slice contiguous because a batched GEMM needs uniform strides, while the fused kernel indexes q/k/v straight out of the (B, T, 3C) projection — one block owns one head, so the head offset is a constant on the row pointer.
Backward never stores the score matrix either. It rebuilds the probabilities from the saved log-sum-exp, which is exact and needs no reductions at all: P[i,j] = exp(S[i,j] − lse[i]). Recomputing S costs one matmul; reading a stored score matrix back costs 25 MB of DRAM per layer. On this card that trade is not close. It is two kernels rather than one, because dQ reduces over keys while dK and dV reduce over queries — fusing them would push one of the three through global atomics on a tensor the size of the activations. Recompute beats communication, which is this project’s whole lesson restated one level up.
The backward is only 1.19×, and why
The forward result is most of the story; the backward is nearly a wash, and it is worth saying why rather than quoting the forward alone. My first answer was a guess: the fastest backward config ran 64 threads per block at 46 KB of shared memory — two blocks per SM, 8% occupancy. So I added a config with twice the threads. It gained 2.4%. The profiler explains why:
| kernel | L1/TEX | DRAM | compute | occupancy |
|---|---|---|---|---|
forward | 71.3% | 40.3% | 38.4% | 16.1% |
backward dK/dV | 87.7% | 23.9% | 35.8% | 16.4% |
backward dQ | 88.2% | 21.0% | 34.3% | 16.3% |
L1/TEX saturated near 70% with DRAM at ~21% is a signature this project has met before — kernel 6 showed 81% against 15%. Shared memory and L1 share the LSU/MIO datapath, so this is shared-memory→register traffic and the FMA pipes are starved. The same disease as kernel 6, one level up the hierarchy. Counting loads per FMA agrees: the forward spends 12 shared loads on 32 FMAs in its P@V loop, the backward accumulation spends 16 on 32. That is also why more threads did not help — a narrower column tile buys occupancy by loading more per unit of arithmetic, so the two effects nearly cancel.
What the memory actually buys: twice the context
The speedup is nice; the memory is the part that changes what the card can do. Unfused attention is quadratic in context length, fused is linear. Total resident memory at batch 16 — parameters, gradients, Adam state, activations and backward scratch:
| context | fused | unfused |
|---|---|---|
| 256 | 0.91 GB | 1.23 GB |
| 512 | 1.65 GB | 2.64 GB |
| 1024 | 3.15 GB | 6.42 GB |
| 2048 | 6.13 GB | 17.94 GB |
| 3072 | 9.12 GB | out of memory |
| 4096 | 12.11 GB | out of memory |
The card this was measured on has 8 GB. The unfused path tops out at context 1024; the fused path trains at context 2048, and the unfused path would need nearly three times the card to do the same. Fusing attention doubled the context that GPU could train. The 5080’s 16 GB moves the ceiling without changing the ratio — the fused path still holds twice the context of the unfused one, on twice the memory.
A thing worth knowing on Windows: a successful cudaMalloc is not evidence that a model fits. WDDM will oversubscribe VRAM into system memory and page, so the 17.94 GB allocation above succeeded and then ran at a crawl. The number that means something is the total against the card’s memory.
Twenty percent that was hiding behind a square benchmark
The benchmark above measures square matrices. The model does not run square matrices — its matmuls are 4096×384×384, 4096×1536×384, 384×384×4096. I had written that sentence in the README months earlier as an explanation for why end-to-end throughput sits below the headline GFLOP/s, and never measured it. So ./bench/sgemm got --mnk M,N,K, and two pieces of free performance fell out immediately.
| shape (M×N×K) | what it is | k7 (in use) | k8 | k9 (TF32) |
|---|---|---|---|---|
| 4096×1152×384 | qkv projection | 6112 | 6517 | 7482 |
| 4096×384×384 | attention out | 4068 | 4353 | 6176 |
| 4096×1536×384 | MLP up | 5651 | 6026 | 7396 |
| 4096×384×1536 | MLP down | 4377 | 4658 | 6929 |
First: the model’s GEMM was built on kernel 7, and kernel 8 beats it at every one of these shapes. The transpose-aware GEMM was written against the kernel-7 structure, kernel 8 added double buffering afterwards, and the model simply never got the prefetch — on about 80% of a training step. Porting it across took 11.4% off the step, with the arithmetic untouched: loss and gradient norm identical to every printed digit.
Nothing was broken. No bug, no regression, every test passing the whole time. It was invisible because the benchmark measured a shape the model does not run.
The speedup that did not survive integration
Second: the tensor-core kernel is 1.22–1.58× faster than kernel 7 at these shapes — a wider margin than the 1.30× it manages on square matrices, because skinny matmuls starve the fp32 pipes harder than they starve the tensor cores. So I built a TF32 path for the model’s GEMM. Wired into training it was 2.4% slower.
A speedup that does not survive integration is a measurement that has not finished. Timing the same entry point both ways, per shape and per transpose case, gave a split so clean it named the cause by itself:
| case | TF32 vs fp32 | |
|---|---|---|
| NN, NT — A not transposed | 1.10–1.47× | tensor cores win |
| TN, TT — A transposed | 0.64–0.87× | tensor cores lose |
WMMA wants its A fragment stored m-major. Holding As[m][k] forces the transposed case to scatter four scalars for every float4 read, where the fp32 kernel stores As[k][m] and gets a straight vector copy. And the backward pass computes every weight gradient as TN — so the forward won, and the backward handed the winnings straight back.
The fix is not to pick a better tile. It is to stop insisting on one storage orientation: keep each operand in whichever layout makes staging a vector copy, and choose the fragment layout to match — col_major when the operand arrived transposed. Same bytes, same mma instruction, no scatter.
| case | before | after |
|---|---|---|
| TN | 0.64–0.84× | 0.96–1.33× |
| TT | 0.69–0.87× | 1.13–1.43× |
| end to end | 2.4% slower | 9.8% faster |
Does TF32 cost the model anything?
Full 5000-step runs, same seed, same configuration, clock pinned. Measured on the 4070, which is the card the fp32-vs-TF32 pair was run on; the 5080 numbers this page opens with are TF32 throughout.
| step | tokens/s | best val | at step | |
|---|---|---|---|---|
| fp32 | 75.1 ms | 54,516 | 1.5138 | 2400 |
| TF32 | 67.6 ms | 60,568 | 1.5178 | 2800 |
The validation losses differ by 0.004 nats. That is comfortably inside the run-to-run spread this setup shows from fp32 summation order alone — across configurations on the same data and seed I have measured 1.5035, 1.5056, 1.5138, 1.5147, 1.5178 and 1.5194. So TF32 buys 10% of training time and costs nothing I can distinguish from noise, which is why every framework defaults to it on Ampere and later.
It stays opt-in here rather than becoming the default, because it changes what the model computes and one run on 1 MB of Shakespeare is not enough evidence to make that choice silently for someone else. Together the two changes took a training step from 85.0 ms to 67.6 ms — and both were found by measuring the shapes the model actually runs instead of the ones the benchmark happened to default to.
Two GPUs, and the lesson that turned out to be wrong
The received wisdom about multi-GPU training is that communication becomes the bottleneck. Split the work across two cards and the interconnect, not the arithmetic, is what limits you. I rented two A40s to see it happen.
First, the collective itself. No NCCL — for the same reason there is no cuBLAS here. A ring all-reduce splits the gradient buffer into n chunks and runs two phases of n−1 steps, reduce-scatter then all-gather, with every device sending and receiving at once. Each device moves 2(n−1)/n · S bytes, which stops growing with n, and every link stays busy. That is why bandwidth-optimal collectives are rings.
The driver said peer-to-peer worked. It did not.
cudaDeviceCanAccessPeer returned true both directions. cudaDeviceEnablePeerAccess succeeded. Every cudaMemcpyPeerAsync returned success, every stream synchronise returned success — and the bytes never arrived. PCIe ACS or IOMMU misconfiguration on a virtualised host, which is most rented hardware.
It failed silently. The all-reduce reported error exactly 1.00 — the result was exactly zero — at 0.2 GB/s. And before the test caught it, the training log had already said so in a way I nearly missed: one rank reported a gradient norm of 15.023, two ranks reported 7.672. Exactly half, because each rank kept its own shard’s gradient and then divided by the rank count. No sum ever happened, and the loss curve looked entirely reasonable while it did not.
So ddp_init now sends four bytes across every enabled pair and reads them back before trusting the flag, falling back to host staging for any pair that fails. A capability bit is a claim, not a measurement. With staging the collective is correct: 43 MB in 8.65 ms, 5.0 GB/s — a round trip through host memory, roughly a quarter of what the gen4 x16 link should manage directly.
Communication was 6%. Two GPUs were still slower than one.
| ranks | global batch | per GPU | step | tokens/s | comm |
|---|---|---|---|---|---|
| 1 | 16 | 16 | 40.9 ms | 100,206 | — |
| 1 | 32 | 32 | 77.5 ms | 105,707 | — |
| 2 | 32 | 16 | 149.1 ms | 54,951 | 8.9 ms (6.0%) |
Two A40s deliver roughly half the throughput of one, and the interconnect accounts for six percent of it. The wire is not the problem. The host loop is: one process driving both devices, with blocking calls inside the step, so the two GPUs barely overlap. Giving each rank its own thread — CUDA’s current device is per-thread — moved it from 159 to 149 ms. Real, and nowhere near the ~85 ms two genuinely overlapped ranks should reach.
Chasing that further turned up a bug worth the trip on its own. The loss reduction cached its output scalar in a static device pointer, so every rank got the same pointer, allocated on whichever device called first — one rank reducing into another rank’s memory, both racing to read one scalar. It produced plausible losses the whole time.
I went looking for the communication wall and found a scheduling problem wearing its coat. That is worth more than confirming the slogan would have been: “communication is the bottleneck” is a claim about a ratio, and at 10.8M parameters on two cards the ratio is not what the slogan assumes. Knowing which side of it you are on requires measuring both — and the measurement said the collective was cheap and correct while my orchestration was neither. Full log: bench/logs/multigpu_a40.txt.
Attention on the tensor cores, and a round trip that vanishes
Every matmul in the project ran on tensor cores under --tf32 except the ones inside attention, which stayed on fp32 FMAs with 4×2 and 4×4 register tiles while the model’s own GEMM ran 8×8. That gap was most of why the fused backward beat the unfused path by only 1.06×. Attention was the last consumer in the repo computing a matmul the slow way.
Porting it turns on one fact. S = Q@Kᵀ comes out of an mma as an accumulator, and P = softmax(S) then has to go back in as the A operand of P@V. If those layouts agree the fragment is reused in place; if they do not, P goes through shared memory — and that round trip is the structural reason the backward was slow.
They do not agree, and I measured rather than recalled — a fragment layout guessed wrong is silent, which kernel 10 had already learned once about the a1/a2 order. The m16n8k8 TF32 accumulator holds reg i of lane L = (row = L/4 + 8·(i/2), col = 2·(L%4) + i%2), verified against all 128 entries of a matrix built so each decodes by inspection. The A operand wants columns {t, t+4} where the accumulator holds {2t, 2t+1}. The f16 shapes happen to agree, which is why FlashAttention-2 gets the fused form for free and TF32 does not.
But the disagreement is confined to the four lanes that share a row group, so eight __shfl_synces convert one to the other exactly, and P never reaches shared memory at all. One trap on the way, worth stating because it is silent: shuffling the already-selected register — __shfl_sync(m, par ? d[1] : d[0], src) — reads whichever register the source lane’s own par chose. It lands on the neighbouring column and stays entirely plausible. Both registers have to be shuffled and the selection applied afterwards.
The backward needed a transpose, and did not get one
The forward ports directly and is 1.81× the best fp32 tile. The backward is two kernels and only one of them is that easy: dQ’s second matmul reduces over keys, so its A operand is dS in the accumulator’s own orientation. But dK/dV reduces over queries — dV[c][j] += Σ P[i][c] dO[i][j] — so its A operand is P transposed, and transposing an accumulator is exactly the round trip being deleted.
So that kernel does not compute S. It computes Sᵀ = K@Qᵀ directly, key as M, and its accumulator is [key][query] from the start — the orientation the second matmul wants. The reorientation is free, and the reason is the part worth keeping: the backward needs no row reductions at all. The forward must reduce along a query’s keys for the running max and sum; here lse and D are already known, so P and dS are elementwise with a per-query scalar.
| fused backward | best fp32 | both mma | vs unfused | |
|---|---|---|---|---|
| ctx 256 | 1.335 ms | 0.881 ms | −34.0% | 1.06× → 1.59× |
| ctx 512 | 2.416 ms | 1.515 ms | −37.3% | 1.06× → 1.70× |
| ctx 1024 | 4.411 ms | 2.779 ms | −37.0% | 1.11× → 1.77× |
| ctx 2048 | 8.407 ms | 5.206 ms | −38.1% | 1.15× → 1.84× |
End to end, both arms with --tf32 matmuls and attention pinned each way: −6.9% of a training step at ctx 256, −18.5% at 1024, −24.3% at 2048. The win grows with context because attention’s share of the step does.
How you tell a port from a corruption: one config ports dK/dV and leaves dQ in fp32, and its error signature is dq 3.00e-07, dk 6.01e-04, dv 3.54e-04 — fp32 precision exactly where the fp32 kernel still runs, TF32 where the new one does. Only dQ’s tolerance is relaxed, per config. A blanket tolerance would have hidden corruption in the other two. Errors stay in a 1.8e-04 to 9.6e-04 band across ctx 1, 33, 63, 100, 256, 512, 777 and 1024 — ragged shapes being where a transposed kernel’s indexing breaks first.
A stale constant, and two wrong explanations for it
With attention ported the matmuls are back to roughly 72% of a step, so the next thing is the tensor-core dispatch’s choice between a 128×128 tile and a 64×128 one. Its rule was TILE_SWITCH_BLOCKS = 72 — two blocks per SM across the 36 SMs of the 4070 it was written on. The card it now runs on has 46. Re-measuring is worth 7.6% of a training step, 43.6 → 40.2 ms, and lifts mlp up to 96.5% of the ladder’s own square-N peak.
The interesting part is that I explained it wrong twice, and both times building the explanation is what exposed it.
Wave quantisation was the first: 96 blocks against 46 SMs × 2 = 92 slots is one full wave plus four stragglers. The control that killed it was forcing the narrow tile on every shape — it wins at 384 blocks as decisively as at 96 — and the arithmetic agrees it was never the story, since 96-into-92 and 192-into-184 are the same 52% efficiency.
The roofline was the second, and wrong more interestingly. A BM×BN tile reads (BM+BN)·BK·4 bytes per 2·BM·BN·BK flops, so its arithmetic intensity is BM·BN / 2(BM+BN): 32.0 FLOP/byte wide, 21.3 narrow. This card’s ridge point is 21.0 — so the narrow tile clears it and the wide one does not, which explains the measurement and the 4070’s opposite result. A tidy story.
| evaluated at | peak fp32 | ridge point | narrow (21.3) clears? |
|---|---|---|---|
| pinned 1.20 GHz | 14.1 TFLOP/s | 21.0 | yes — by 1.4% |
| base 1.45 GHz | 17.1 TFLOP/s | 25.4 | no |
| boost 3.09 GHz | 36.4 TFLOP/s | 54.1 | no |
I had picked the one clock that made the story work. Writing it as a threshold is what caught it — the rule promptly selected the wrong tile, because at the device’s base clock 21.3 does not clear 25.4. A rule that flips on a 1.4% margin is numerology, not physics, and the intensity model ignores L2 reuse, which at these shapes is large.
What survives is the ratio between machines, robust where the knife-edge was not: the 4070’s ridge is ~44 at base clock against this card’s 25.4. So the rule shipped is empirical with the roofline as motivation — take the narrow tile unless the machine’s ridge sits above the wide tile’s intensity, i.e. unless it is bandwidth-starved enough that intensity is the limit. Both cards clear by 20–40%, it is evaluated at base clock so it is deterministic, and it is calibrated on two data points and labelled as such rather than dressed up as a law.
The largest line was losing 27% to an integer division
The re-profile the list below asked for happened, and it named the weight-gradient matmuls: 26.2% of a step, the single largest line, and the slowest GEMMs in the model — 7,700–8,300 GF/s at the dW shapes against 11,300 for mlp up in the same transpose case. Following that lead found the third stale 36-SM constant, in the split-K rule this time, and fixing it the obvious way — derive the target from the SM count — moved the two small shapes 13–17% and the end-to-end step by an amount three samples genuinely could not separate from noise. I wrote down that the two big dW shapes were not a split-K problem, because their split count had not changed.
That sentence was wrong, and it was wrong for the usual reason: I checked whether the count had changed, not whether it was right. Asking cuBLAS for its throughput at the model’s own shapes — rather than extrapolating from square N — showed it flat at ~12,300 GF/s on both mlp up and dW fc, while mine dropped 25% between them. Same kernel, same instruction, same flop count: the gap was a property of my decomposition, not of the shape. So instead of trusting the rule, I swept the parameter it produces:
| shape (TN, TF32 GF/s) | s=1 | s=2 | s=5 | s=7 | s=10 |
|---|---|---|---|---|---|
dW fc 384×1536×4096 | 8232 | 8601 | 10819 | 10968 | 10527 |
dW qkv 384×1152×4096 | 6212 | 8222 | 10570 | 10149 | 10406 |
mlp up 4096×1536×384 | 11382 | 7807 | 6968 | 6969 | 6952 |
Italic is what the old rule picked: integer division put dW fc at two splits, 8,601 against a swept 10,968 — 27% left on the largest line in the step. The replacement rule keeps two quantities the old one conflated: a split’s cost is fixed (every split rewrites the whole output and the reduction reads every plane back) while its benefit shrinks as K is cut thinner, so no split may own fewer than a dozen k-chunks — the term that protects every K=384 shape, which fall off a cliff at s=2 — and past a few grid-fulls of blocks further splits are pure reduction traffic. Interleaved A/B, four rounds: 3.8% of a training step, and the weight gradients went from 70% of cuBLAS TF32 to 87% — from the worst shapes in the model to the middle of the pack.
A constant that survives a change to the formula around it has not been validated by surviving. The sweep now lives in test_gemm --splitk, because the derived value is one point on a curve, and the only way to know it is the right point is to have seen the curve.
What did not work on the same line is worth recording too. The tensor-core kernel overlaps nothing across its global reads, and both ways to fix that are blocked by different resources: a second cp.async stage costs the second resident block (shared memory), and prefetching the next k-chunk into registers — 48 of them — buys a 176–284 byte stack frame per thread, because the narrow tile already sits at 126 of its 128-register budget with nothing spilled. 5–22% slower at every model shape. It is not near its budget; it is at it. That is a wall, not a missing optimization, and knowing which resource blocks which route is what the failed experiment bought.
A comment claimed bit-for-bit runs. The fourth decimal disagreed.
The bias-gradient reduction refuses atomics, with a comment explaining why: they would make the gradient depend on block scheduling order, “and this repo compares runs bit for bit.” Forty lines up, the layernorm backward did atomicAdd twice per element — 3.1 million contended adds on 768 addresses. Both could not be right, and the claim is testable: two runs, same seed, print the losses.
run1 4.2487  run2 4.2487  same
run1 3.0670  run2 3.0670  same
run1 2.7130  run2 2.7135  DIFFERS
The comment was aspirational and had been sitting there being believed. I removed the layernorm’s atomics — a fixed thread-to-column map with partials summed in a fixed order — re-ran the check, got identical losses, and wrote down that it was fixed. That was wrong too, and the next seed said so: the embedding backward still accumulates by atomics, and there the collisions are real — many positions share a token id — rather than an artifact of kernel arrangement. One seed agreeing across two runs is one sample of a difference that lives in the fourth decimal. The honest state, now written where the claim used to be: the avoidable nondeterminism is gone, the structural kind remains, and the repo no longer says otherwise.
The tuning pass on those two reductions was worth only ~0.5% of a step — both were at a tenth of the roofline and are now near half, one of them held back by a fourth stale 36-SM constant. The micro-benchmark written to tune them said the rewrite was 2.9× faster; in the step it was slower. Its working set fit in L2 and the timing loop re-read it thirty times — it was measuring a cache curve, and in a step these buffers compete with the whole model and come from DRAM. The benchmark survives with that caveat written on it, which is the only condition under which a benchmark that lied should survive.
Two kernels that did not need to exist
The forward pass learned this early: bias, residual and GELU ride the GEMM epilogue, where the value is in a register with a store already happening. The backward never got the same treatment, and the profiler kept pointing at the two places it showed.
The GELU backward read the gradient, read the pre-activation, and wrote the product — three passes over 25 MB per layer for one multiply per element — consuming a tensor the dX GEMM had produced microseconds earlier. The derivative now rides that GEMM’s epilogue: a 1.361 ms kernel became 0.051 ms of epilogue, 2.9% of a step, with bit-identical gradient norms, and the tensor that existed only to hand data between the two kernels is deleted outright — resident memory 0.84 → 0.81 GB.
The bias gradient is the better story. Every weight gradient is dW = dY ᵀ @ X, and the same layer’s bias gradient is the column sum of the same dY — along exactly the K axis that GEMM iterates, over exactly the values its staging already loads into registers. As its own kernel the sum cost 1.458 ms a step re-reading 100 MB a GEMM had just read. Fused, one block column accumulates four FADDs per staged float4, folds partials through shared memory the operand tile no longer needs, and — the part the next-steps note worried about — split-K turns out to be bookkeeping, not a wall: per-split partials share the workspace the output planes already use, and the existing reduction folds them in a fixed order. No atomics, and the test suite holds it to that the only way that means anything: two identical calls must return bitwise-identical gradients, at every split count.
| narrow tile, TN | registers | spill |
|---|---|---|
without dbias_out | 126 | 0 B |
with dbias_out | 128 | 4–8 B |
The cost is the same register wall that blocked the prefetch, priced small enough to pay this time: four registers instead of 48, four bytes of spill instead of hundreds, about 1% on the dW region for deleting a kernel worth sixteen times that. Interleaved A/B, four rounds: 36.55 → 35.30 ms median, 3.4% of a training step, and the profiler shows the mechanism exactly — bias backward gone from the profile, GEMM bwd dW up 0.092 ms. The fp32 path keeps the standalone reduction and matches the old build to every printed digit, which is the control that says the machine held still.
The layernorm backward is the reduction that does not get this treatment, for a structural reason worth stating: its column sum is over dY·x̂ — a product no GEMM ever stages — so there is no free ride to hitch. Knowing why the trick stops is worth almost as much as the trick.
The attention backward was starved of warps, not bandwidth
With the matmuls near their ceiling the largest single-kernel line left was the fused attention backward: 14% of a step, at about 60% of the forward’s efficiency with 2.5× its flops. Every tile sweep this repo had run on that kernel assumed the reason was the usual one — shared-memory traffic — and had found that every arrangement which improved the shared-loads-per-FMA ratio spent shared memory to get it and lost a resident block. The profile, once someone was at the machine to approve the prompt it needs, said something different.
| kernel | theoretical occupancy | limiter | compute | shared (L1/TEX) |
|---|---|---|---|---|
| forward (tensor cores) | 25% | — | 46% | 49% |
| backward dK/dV | 8.3% | shared memory, 2 blocks/SM | 28% | 39% |
| backward dQ | 8.3% | shared memory, 2 blocks/SM | 23% | 34% |
Both backward kernels ran in 64-thread blocks, two per SM: four warps per SM, nothing saturated, a third of the stall cycles waiting on shared loads that four warps cannot hide, and a register budget that would have allowed six blocks. The forward, at three times the occupancy, reaches twice the utilisation. The kernel was not bound. It was alone.
The cheapest way to double the warps without touching the footprint is to split each 16-row tile’s work across two warps along the other axis — in dK/dV, a warp takes its 16 keys against half the query tile; in dQ, its 16 queries against half the key tile — and fold the two halves once per block through operand memory the loop has finished with. Same lane mapping on both sides, so the fold is a copy and an add. The one-warp originals stay in the config table, so the comparison is inside one binary:
| fused backward, T=256 | ms | TFLOP/s | |
|---|---|---|---|
| one warp per tile, both kernels (the old default) | 0.451 | 6270 | |
| dK/dV split only | 0.361 | 7835 | 1.25× |
| both kernels split | 0.304 | 9309 | 1.40× |
Errors identical to the last digit, ragged shapes pass, the TF32 trajectory matches the recorded one to four decimals with last-digit drift where the dQ partials are now summed in a different order. In the step, pinned, medians of four alternated profiled runs: attention backward 5.65 → 4.00 ms, the attention forward unchanged as a control, and the step 38.07 → 36.15 ms — five percent. The backward now runs at 9.3 TFLOP/s against the forward’s ~11; what separates them is the recomputation of S and dP in both kernels, which is structural to the two-kernel split.
A paragraph of reasoning this writeup had carried for months — that the backward was bound on shared-memory traffic and every fix cost a resident block — was true of the fp32 kernel it was written about and false of the tensor-core kernel that replaced it. The counter that mattered was occupancy, and it took thirty seconds to read.
The same instructions got more expensive
Moving to a third card reordered the ladder, which is not something an algorithm is supposed to do. Kernel 7 is now slower than kernel 6, where on the 4070 it was faster. And kernel 9 — the WMMA tensor-core kernel — fell to 64.8% of cuBLAS from 117.6% on Ada, putting it below the plain fp32 double-buffered kernel. Both inversions reproduce on a 5070 Ti, so neither is a bad sample.
Dividing out the SM count, which is the only fair way to compare three cards, and normalising each kernel to its own Ada number:
| kernel | 4070 (Ada) | 5070 Ti | 5080 |
|---|---|---|---|
k8 dbuffer (fp32) | 100% | 98% | 95% |
k10 mma.sync + LDS | 100% | 94% | 92% |
| k9 WMMA | 100% | 58% | 57% |
The SASS says what differs, and it is not the tensor-core work: both kernels issue exactly 128 HMMA. The loads differ. Kernel 10 issues 32 LDS; kernel 9 issues 128 generic LD and not one LDS, despite reading its fragments out of __shared__ memory. wmma::load_matrix_sync takes an opaque fragment type, the address space is lost at the API boundary, and the compiler falls back on generic addressing.
My first guess was wrong, and that is the useful part. I expected a Blackwell codegen regression. Compiling the same source for sm_89 and sm_120 gives 960 and 984 instructions with the same 128 LD and 128 HMMA in both. Ada emitted those generic loads too. The instruction mix did not change — its price did. The identical structural weakness cost about 10% on Ada and costs 43% here.
Which retroactively raises the value of kernel 10. When it was written, hand-written PTX at the same tile shape was worth only 2.7%, and the honest conclusion was that most of its win came from a wider warp tile instead. On this card the same choice — owning the shared layout so the loads can be LDS — is worth 1.8×. An optimization that is marginal on the hardware you have can be the one that survives the hardware you get, and the only way to find out is to keep the losing branch and re-run it.
The warp-tile A/B above is the same finding from the other end. There, 128 generic loads against 32 shared ones cost 43%. Here, a third less shared traffic costs 0%. Two experiments aimed at different kernels, agreeing that on this architecture what matters is which load path you are on, not how much shared traffic you move. Neither would have supported that alone.
What I’d do next
Raw— done, above. 8318 → 9210 GF/s on the ladder. The hypothesis behind it was wrong, which is the part worth keeping.mma.synccp.asyncBK: reuse per barrier.Fuse attention— done, and then ported to tensor cores, above. The prescription this list used to carry — chunk the head dimension so bigger register tiles stop competing with more blocks per SM — was carried out, and it works structurally while buying only 0.4–3.5%. The sharpest datum from it is the config that frees a third resident block with nothing traded away and is not one percent faster. Attention is no longer computing anything on fp32 FMAs.Re-profile before choosing the next thing.— done, and it drove the three sections above: the profile named the weight gradients, the weight gradients exposed the split-K curve, and the curve’s fix left the two epilogue fusions as the largest non-GEMM lines standing. The step is now ~35 ms TF32 against the 46.8 that list item was written at — with the caveat that absolute times drift a couple of percent with how well the clock pin holds, which is why every claim above is an interleaved ratio rather than a pair of numbers from different days.- What the profile says now: the backward matmuls,
dWanddX, are ~25% of a step each, and the cheap routes into both are measured shut — the staging overlaps are blocked by shared memory on one side and the register file on the other, and the split counts now sit on their measured curve. The attention backward, which this list used to call “a redesign, not a parameter,” turned out to be a parameter after all — see above. After it, the layernorm passes were the largest non-matmul lines at 3.6× their bandwidth floor, for the same kind of reason (one block per row, barrier reductions, one row in flight); one warp per row with shuffle reductions took the backward from 1.60 to 1.11 ms and the forward from 0.56 to 0.30, about two percent of a step. What remains between the layernorm backward and its floor is not the warp count — 23 and 46 blocks read the same — and the next suspect is the launch overhead of two kernels per call, twelve calls a step. Multi-GPU— done, in the sense that matters: the missing time was found in places no GPU profile could see, and it took three bugs of one species. The per-step worker threads were created fresh each step, and every per-device cache in the codebase isthread_local— deliberately — so a one-step thread paidcudaMallocHostunder a process-wide lock every step and leaked as it died. Persistent workers took 2×A40 from 149 to 91 ms. Then two more: a gradient-norm scratch in a plainstaticthat one rank read from the wrong device, and flash kernels whose shared-memory opt-in was guarded per process when kernel attributes are per device. With those fixed, the B=32 step is 40.2 ms against 59.9 on one GPU — 1.49× on two, loss and gradient norm identical to every digit, and the prediction on record (41 ms plus comm) came in at 40.2 including it. Communication is now the largest non-compute line at 18.7%, staged through host memory because this host’s PCIe peer-to-peer is advertised and broken. “Communication becomes the bottleneck” turned out to be true — after sixty milliseconds of something that was not communication had been removed from in front of it. One anomaly stays open, and it has a reproducer now: a two-rank run that follows certain predecessor processes reads the same wrong step-1 losses on both ranks every time, with a doubled gradient norm, and is clean when run again immediately. Scrubbing device memory between the processes changes nothing, the sanitizer finds no uninitialized reads, no shared-memory race and no out-of-bounds access — and yet under the sanitizer the same step reads a third pair of losses. Every signature fits wrong tokens or targets reaching a device, so the trainer now checks exactly that at step one